在16位、100kSPS数据采集系统中实现低功耗和高性能
rgb(0,0,0); TEXT-INDENT: 0px; PADDING-TOP: 0px; WHITE-SPACE: normal; LETTER-SPACING: normal; webkit-text-size-adjust: auto; orphans: 2; widows: 2; webkit-text-stroke-width: 0px">PC with USB port, USB cable, and installed 10-lead PulSAR software
Setup and Test
The block diagram of the ac performance measurement setup is shown in Figure 9. Connect the 2.5 V and 4 V power supply to the evaluation board power terminal.
To measure the frequency response, connect the equipment as shown in Figure 9. Set the Audio Precision SYS-2522 signal generator for a 10 kHz frequency and a 2.5 V p-p sine wave with a 1.25 V dc offset. Record the data using the evaluation board software.
The software analysis is part of the evaluation board software that allows the user to capture and analyze ac and dc performance.
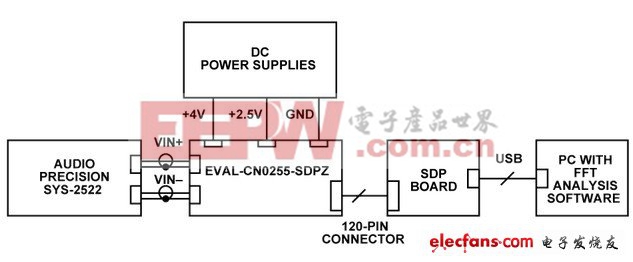
Figure 9. Circuit Test Setup for Measuring AC Performance

加入微信
获取电子行业最新资讯
搜索微信公众号:EEPW
或用微信扫描左侧二维码